
The hammer candlestick is one of the most widely recognized candlestick patterns in technical analysis. It often signals a potential trend reversal, making it essential for traders who rely on price action. Traders across Forex, stocks, commodities, futures, and cryptocurrency markets use this pattern to identify potential market bottoms and bullish reversals.
What makes the hammer especially valuable is the story it reveals about market psychology. The pattern shows that sellers initially pushed prices significantly lower, but buyers stepped in aggressively and forced price back toward the session high. This rejection of lower prices can signal that bearish momentum is weakening and that a bullish reversal may be developing.
What Is a Hammer Candlestick?
A hammer candlestick is a single-bar pattern that appears after a downtrend and signals a potential bullish reversal. It features a small real body near the top of the range and a long lower shadow, typically at least twice the size of the body.
Some traders say that for a candle to be a valid hammer, the lower wick must be three to four times longer than the size of the body of the candle. In addition the hammer must have little to no upper wick. Generally, a valid hammer must have a lower shadow of 2 times the body size as a minimum. The image below shows an example of a hammer.
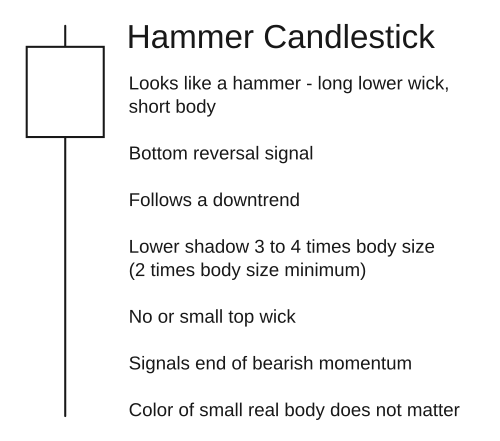
The pattern develops when sellers initially dominate the trading session and drive prices lower. However, buyers eventually absorb the selling pressure and push the market back upward, causing the candle to close near its opening price and near the high of the session.
This dramatic recovery from the lows suggests that buyers may be regaining control and that the existing downtrend could be losing momentum.
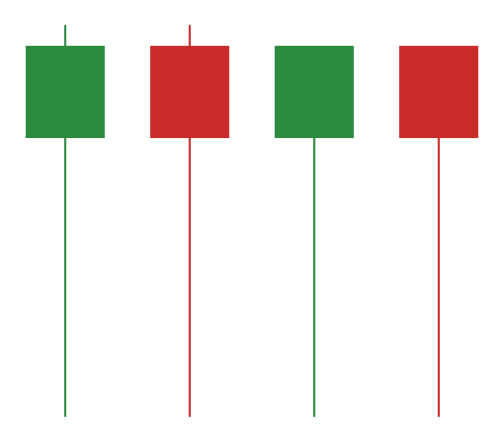
A hammer can be either bullish (closing above the open) or bearish (closing below the open). However, both versions are generally considered bullish reversal signals when they form after a downtrend. A bullish-colored hammer is often viewed as slightly stronger because it demonstrates greater buying pressure during the session.
Hammer Candlestick Definition
A valid hammer candlestick typically has the following characteristics:
- A small real body located near the top of the candle’s trading range
- A long lower shadow that is at least twice the size of the real body
- Little or no upper shadow
- Formation after a noticeable decline or established downtrend
- Evidence of strong rejection of lower prices
Many experienced traders prefer hammers where the lower shadow is three to four times larger than the body, as these candles often represent stronger buying pressure and more decisive rejection of lower prices.
The hammer becomes significantly more reliable when it forms at an important support level, a previous swing low, a Fibonacci retracement level, a trendline, or another area where buyers have historically entered the market.
While the hammer is a relatively simple one-candle pattern, it should never be viewed in isolation. Its effectiveness depends heavily on factors such as trend direction, support levels, volume, and confirmation from subsequent price action. When combined with proper market context, the hammer can become a valuable tool for identifying high-probability trading opportunities.
How to Identify the Hammer Candlestick Pattern
Correctly identifying a hammer candlestick requires more than simply finding a candle with a long lower wick. The surrounding market context is equally important.
To identify a valid hammer pattern, look for the following characteristics:
- A clear downtrend or sustained bearish price movement preceding the candle
- A small real body positioned near the top of the candle’s range
- A lower shadow that is at least two times the size of the body
- Very little or no upper shadow
- Strong rejection of lower prices during the candle’s formation
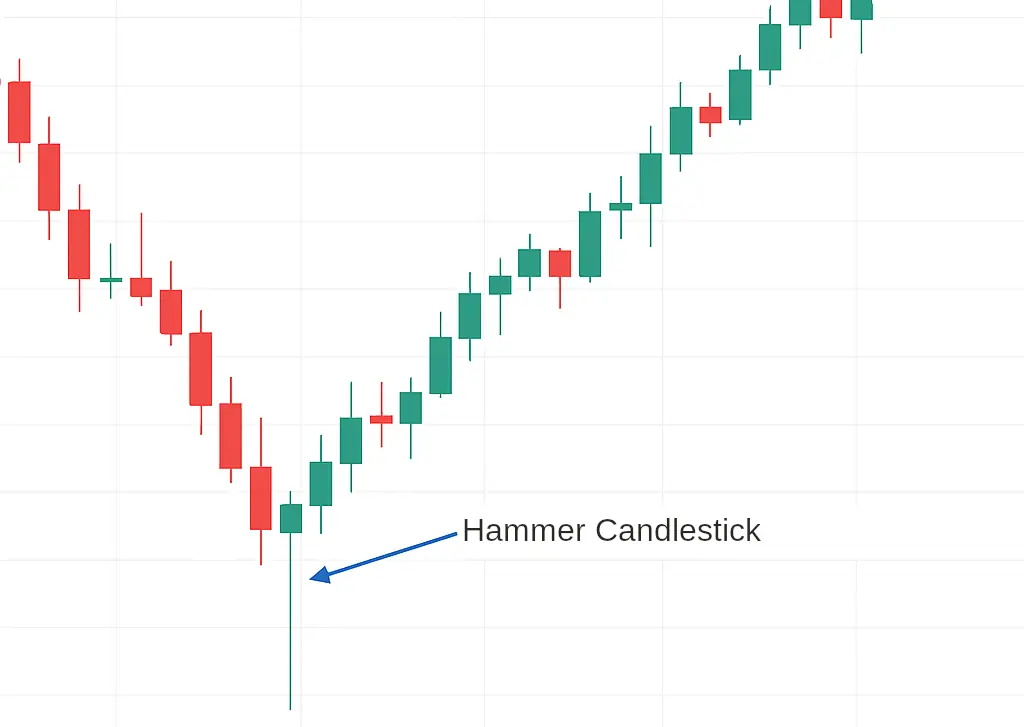
The most important requirement is that the hammer appears after a decline. Without a preceding downtrend, the candle loses much of its significance as a potential reversal signal. The following image shows an example of a hammer candlestick formation after a downtrend.
The following image shows various examples of valid hammer candlestick patterns.
Checklist for Identifying a Valid Hammer Candlestick
| Characteristic | Requirement |
|---|---|
| Trend Direction | Existing downtrend or bearish move |
| Real Body | Small body near the candle high |
| Lower Shadow | At least 2x body size |
| Upper Shadow | Small or nonexistent |
| Market Context | Near support or a potential reversal area |
| Confirmation | Ideally followed by bullish price action |
Although hammer candlesticks can appear on any timeframe, many traders consider them more reliable on higher timeframes such as the 4-hour, daily, and weekly charts. Higher timeframes generally contain less market noise and often produce stronger reversal signals.
Bullish vs. Bearish Hammer Candlestick
The term “bearish hammer” often creates confusion among traders because a true hammer is generally considered a bullish reversal pattern.
Bullish Hammer
A bullish hammer forms after a downtrend and signals that buyers may be beginning to take control of the market.
Characteristics include:
- Appears after a sustained decline
- Shows strong rejection of lower prices
- Suggests weakening bearish momentum
- Often followed by a bullish confirmation candle
- Can signal the beginning of a trend reversal or significant pullback
This is the classic hammer pattern discussed in most technical analysis literature.
Bearish Hammer and Common Misconceptions
Many traders mistakenly refer to any hammer-shaped candle as a bearish hammer when it appears in an uptrend. In reality, the market context changes the pattern’s interpretation.
A hammer-shaped candle appearing after an uptrend is usually classified as a Hanging Man rather than a hammer. The Hanging Man is considered a potential bearish reversal signal because it suggests that sellers were able to push prices significantly lower during the session despite the existing uptrend.
Similarly, a candle with a long upper shadow that appears after an uptrend is typically classified as a Shooting Star, while a similar candle after a downtrend is known as an Inverted Hammer.
For this reason, traders should focus not only on the candle’s shape but also on where it forms within the broader trend.
How to Trade the Hammer Candlestick Pattern
The hammer should rarely be traded as a standalone signal. The highest-probability setups occur when the pattern forms at a meaningful support level and is confirmed by subsequent bullish price action.
Step 1: Identify a Downtrend
Look for a market that has been moving lower or has experienced a significant pullback. The hammer’s primary purpose is to signal a potential reversal after selling pressure has dominated the market.
Step 2: Locate a Hammer Candlestick at Support
The strongest hammer setups often form at:
- Major horizontal support levels
- Previous swing lows
- Trendline support
- Fibonacci retracement levels
- Psychological round-number price levels
Step 3: Wait for Confirmation
Many professional traders wait for confirmation before entering a trade.
Confirmation may include:
- A bullish candle closing above the hammer
- A breakout above the hammer’s high
- Increasing trading volume
- Bullish confirmation from indicators such as RSI or MACD
Step 4: Enter the Trade
A common entry method is to enter after a bullish candle closes above the hammer or after price breaks above the hammer’s high.
Step 5: Place a Stop Loss
The hammer’s low typically serves as a logical stop-loss location. If price falls below the hammer’s low, the bullish reversal thesis may no longer be valid.
Step 6: Set Profit Targets
Profit targets can be based on:
- Previous resistance levels
- Swing highs
- Fibonacci extension levels
- Fixed risk-to-reward ratios such as 1:2 or 1:3
Example Hammer Candlestick Trading Plan
| Step | Action |
|---|---|
| Identify Trend | Confirm a downtrend or strong pullback |
| Find Pattern | Hammer forms near support |
| Confirmation | Bullish candle closes above hammer |
| Entry | Above hammer high or after confirmation close |
| Stop Loss | Below hammer low |
| Take Profit | Resistance level or predefined risk-reward target |
2 Hammer Candlesticks in a Row: What Does It Mean?
Two consecutive hammer candlesticks, often called a double hammer formation, can strengthen the potential reversal signal.
When multiple hammers form near the same price level, the market is repeatedly rejecting lower prices. This suggests that buyers are actively defending support and that selling pressure may be weakening.
A double hammer pattern may indicate:
- Strong support beneath the market
- Repeated rejection of lower prices
- Growing buyer confidence
- Increased probability of a bullish reversal
Despite the added strength, traders should still seek confirmation before entering a position. Multiple hammers do not guarantee that a reversal will occur.
Three Hammer Candlesticks in a Row: A Rare Triple Hammer Formation
A triple hammer formation occurs when three hammer candles develop consecutively after a decline. Although relatively uncommon, this pattern can attract significant attention from price action traders.
Three consecutive hammers suggest that sellers have repeatedly attempted to push prices lower but have been unable to maintain control. Each rejection reinforces the possibility that an important support zone or accumulation area is forming.
Potential interpretations include:
- Strong accumulation by buyers
- Significant support beneath the market
- Exhaustion of bearish momentum
- Increased potential for a bullish reversal
However, traders should remain cautious. In some cases, multiple hammer candles may simply reflect a period of consolidation rather than the start of a new uptrend. Confirmation through a breakout, higher volume, or strong bullish follow-through remains essential before committing capital.
Tips for Hammer Candlestick Trading
The hammer candlestick can be a powerful reversal signal, but its effectiveness depends heavily on market context and proper trade management. Rather than trading every hammer that appears on a chart, successful traders look for additional evidence that supports the reversal.
Use Volume Confirmation
Volume can provide valuable insight into the strength of a hammer pattern. A hammer that forms with above-average trading volume often carries more significance because it indicates strong participation from buyers.
High volume during the formation of a hammer suggests that market participants aggressively rejected lower prices. Conversely, a hammer that forms on low volume may be less reliable and more susceptible to failure.
Trade Hammers Near Support Levels
Location is one of the most important factors when evaluating a hammer candlestick. The pattern tends to perform best when it forms at a significant support area where buyers have previously entered the market.
Examples of important support levels include:
- Previous swing lows
- Horizontal support zones
- Trendlines
- Fibonacci retracement levels
- Psychological round-number price levels
A hammer that forms at a major support level is generally more meaningful than one that appears in the middle of a trading range.
Wait for Confirmation
Many failed trades occur because traders enter immediately after spotting a hammer. Waiting for confirmation can help filter out weaker signals.
Common confirmation methods include:
- A bullish candle closing above the hammer
- A break above the hammer’s high
- Rising trading volume
- A bullish crossover from a technical indicator
Confirmation does not guarantee success, but it can improve the probability of identifying genuine reversals.
Avoid Trading Hammer Candlesticks During Consolidation
Hammer candles are most effective when they appear after a clear downward price move. In a sideways or range-bound market, hammer-like candles frequently occur without leading to meaningful reversals.
If the market has been moving sideways for an extended period, the hammer loses much of its predictive value because there is no established downtrend to reverse.
Use Technical Indicators for Additional Confirmation
Many traders combine hammer patterns with technical indicators to strengthen their analysis. Using multiple forms of analysis can help traders avoid relying solely on a single candlestick pattern.
Popular confirmation tools include:
| Indicator | What to Look For |
|---|---|
| RSI | Oversold conditions or bullish divergence |
| MACD | Bullish crossover or improving momentum |
| Moving Averages | Price bouncing from a key moving average |
| Stochastic Oscillator | Bullish crossover in oversold territory |
| Volume Indicators | Increased buying activity |
Focus on Higher Timeframes
Hammer patterns can appear on any chart timeframe, from one-minute charts to monthly charts. However, signals on higher timeframes are often considered more reliable because they contain less market noise.
Many experienced traders place greater emphasis on hammers that form on:
- 4-hour charts
- Daily charts
- Weekly charts
A hammer on a higher timeframe often reflects a more significant shift in market sentiment than one that appears on a very short-term chart.
Always Practice Proper Risk Management
Even the strongest hammer setups can fail. No candlestick pattern is accurate 100% of the time.
Before entering a trade:
- Determine your stop-loss level
- Define a realistic profit target
- Maintain a favorable risk-to-reward ratio
- Risk only a small percentage of your trading capital on any single position
Successful trading depends as much on risk management as it does on identifying quality chart patterns.
The Psychology Behind the Hammer Candlestick
One of the reasons the hammer candlestick remains popular among traders is that it provides insight into the battle between buyers and sellers. Rather than simply being a visual pattern on a chart, the hammer reflects a significant shift in market sentiment that can occur near the end of a downtrend.
To understand the psychology behind the pattern, it helps to examine what happens during the formation of the candle.
At the beginning of the trading session, sellers remain in control and continue the existing downward trend. This selling pressure pushes prices significantly lower, creating the long lower shadow that is characteristic of the hammer.
As the session progresses, however, buyers begin to see value at these lower prices and enter the market. Their buying activity absorbs the available selling pressure and eventually pushes price back upward. By the time the candle closes, most or all of the earlier losses have been recovered.
This sequence creates an important psychological message:
- Sellers were initially strong enough to drive prices lower.
- Buyers stepped in aggressively at lower levels.
- Sellers were unable to maintain control.
- Price recovered and closed near the session high.
- Market sentiment may be shifting from bearish to bullish.
The longer the lower shadow, the more dramatic the rejection of lower prices. A hammer with a very long lower wick often indicates that buyers strongly defended a support area.
However, traders should remember that the hammer itself does not guarantee a reversal. It merely signals that buying pressure has appeared. Additional confirmation is usually needed to determine whether buyers can sustain control in subsequent trading sessions.
The psychology becomes even more significant when the hammer forms at a major support level, previous swing low, trendline, or Fibonacci retracement area. In these locations, the pattern may indicate that large market participants are accumulating positions and preventing further declines.
Hammer vs Similar Candlestick Patterns
Many traders confuse the hammer with several other candlestick patterns because they share similar shapes. Understanding the differences is essential because the same candle shape can have very different meanings depending on where it appears within a trend.
Hammer vs Inverted Hammer
The hammer and inverted hammer are both bullish reversal patterns that typically form after a downtrend.
The main difference is the location of the shadow.
| Pattern | Main Shadow | Typical Trend Location | Signal |
|---|---|---|---|
| Hammer | Long lower shadow | Downtrend | Potential bullish reversal |
| Inverted Hammer | Long upper shadow | Downtrend | Potential bullish reversal |
The hammer demonstrates that buyers successfully pushed price back up after a decline. The inverted hammer shows that buyers attempted to push prices higher, suggesting growing bullish interest even though sellers prevented a strong close.
Hammer vs Hanging Man
The hammer and hanging man can appear almost identical, but they occur in different market conditions.
| Pattern | Appearance | Trend Location | Interpretation |
|---|---|---|---|
| Hammer | Long lower wick, small body | Downtrend | Bullish reversal |
| Hanging Man | Long lower wick, small body | Uptrend | Potential bearish reversal |
The location within the trend completely changes the meaning. A candle that signals bullish potential in a downtrend may become a warning sign of weakness when it appears after a strong rally.
Hammer vs Shooting Star
The shooting star is essentially the bearish counterpart of the inverted hammer.
| Pattern | Main Shadow | Trend Location | Signal |
|---|---|---|---|
| Inverted Hammer | Long upper shadow | Downtrend | Bullish reversal |
| Shooting Star | Long upper shadow | Uptrend | Bearish reversal |
A shooting star indicates that buyers attempted to continue pushing prices higher but were ultimately overwhelmed by sellers before the close.
Hammer vs Dragonfly Doji
The dragonfly doji can resemble a hammer but has an important structural difference.
| Pattern | Body Size | Signal Strength |
|---|---|---|
| Hammer | Small real body | Bullish reversal |
| Dragonfly Doji | Almost no body | Potential reversal depending on context |
Because the open and close of a dragonfly doji are nearly identical, it represents greater market indecision than a typical hammer.
Why Context Matters More Than Shape
A common mistake among new traders is focusing solely on candle shape while ignoring trend direction and market structure.
The same candle can have completely different implications depending on whether it forms after a downtrend, within a trading range, or near the top of an uptrend. Successful traders always evaluate the broader market context before acting on any candlestick pattern.
How Reliable Is the Hammer Candlestick Pattern?
One of the most frequently asked questions is whether the hammer candlestick actually works. The answer is that the hammer can be an effective reversal signal, but its reliability depends heavily on context, confirmation, and overall market conditions.
Like all technical analysis tools, the hammer provides probabilities rather than certainty.
A hammer that appears randomly within a sideways market may have little significance. In contrast, a hammer that forms after a prolonged decline at a major support level and is confirmed by strong bullish follow-through may represent a high-quality trading opportunity.
Factors That Increase Reliability
Several factors can improve the quality of a hammer signal:
- Formation after a well-established downtrend
- Location at a major support level
- Higher-than-average trading volume
- Bullish confirmation from the next candle
- Oversold readings from indicators such as RSI
- Bullish divergence on momentum indicators
- Confluence with trendlines or Fibonacci retracement levels
When multiple bullish factors align, the probability of a successful reversal generally increases.
Factors That Reduce Reliability
Certain conditions can make hammer signals less dependable:
- Sideways or range-bound markets
- Low-volume trading environments
- Strong long-term bearish trends
- Lack of bullish confirmation
- Hammer formations occurring directly beneath resistance
In these situations, the market may continue lower despite the appearance of a hammer.
Why Confirmation Is Essential
Professional traders rarely enter a position solely because a hammer appears on a chart.
Instead, they often wait for:
- A bullish candle closing above the hammer
- A breakout above the hammer’s high
- Increased trading volume
- Confirmation from technical indicators
Waiting for confirmation may reduce potential profit slightly, but it can significantly reduce the number of false signals.
The Hammer Candlestick Is Best Used as Part of a Trading System
The most successful traders do not rely on any single candlestick pattern. Instead, they combine the hammer with trend analysis, support and resistance, volume analysis, risk management, and confirmation techniques.
Viewed in isolation, the hammer is merely a clue. Viewed within a complete trading strategy, it can become a valuable decision-making tool.
Complete Hammer Candlestick Trading Examples
Understanding the theory behind the hammer is important, but seeing how traders apply it in real-world situations is equally valuable.
The following examples demonstrate common ways traders use the hammer pattern in their trading plans.
Example 1: Hammer Candlestick at Major Support
Suppose a stock has been declining for several weeks and approaches a support level that has previously acted as a market bottom.
A hammer forms directly on that support zone with above-average volume.
The next day, a strong bullish candle closes above the hammer’s high.
A trader may:
- Enter after the confirmation candle closes
- Place a stop loss below the hammer’s low
- Target the next major resistance level
This is often considered one of the highest-quality hammer setups because multiple technical factors align.
Example 2: Hammer Candlestick With RSI Confirmation
A cryptocurrency market experiences a sharp selloff and becomes oversold according to the Relative Strength Index (RSI).
A hammer then forms near a previous swing low.
The RSI begins turning upward while price breaks above the hammer’s high.
In this scenario, both price action and momentum analysis support the potential reversal.
Example 3: Hammer Candlestick During a Pullback in an Uptrend
Not all hammers occur at major market bottoms.
A stock in a long-term uptrend may experience a temporary pullback toward a moving average.
A hammer forms at the moving average and is followed by bullish confirmation.
Many trend traders use this type of setup to enter existing trends rather than attempting to predict major reversals.
Example 4: Failed Hammer Candlestick Trade
Understanding failed setups is just as important as understanding successful ones.
Imagine a hammer forms during a strong downtrend but receives no bullish confirmation. Instead, the next candle closes below the hammer’s low.
This price action indicates that sellers remain in control.
A disciplined trader would avoid entering the trade or exit quickly if already positioned.
Sample Hammer Candlestick Trading Plan
| Trading Element | Example |
|---|---|
| Market Condition | Established downtrend |
| Pattern Location | Major support level |
| Confirmation | Bullish close above hammer |
| Entry | Above hammer high |
| Stop Loss | Below hammer low |
| Profit Target | Next resistance level |
| Risk-to-Reward | Minimum 1:2 ratio |
Common Hammer Candlestick Trading Mistakes
Although the hammer is relatively simple to identify, many traders misuse the pattern and generate poor results. Avoiding the following mistakes can improve the quality of your trading decisions.
Trading Every Hammer You See
Not every hammer represents a meaningful reversal opportunity.
Many hammer-like candles appear during normal market fluctuations and carry little predictive value.
Always evaluate trend direction, support levels, and market context before acting on the signal.
Ignoring the Existing Trend
The hammer is primarily a bullish reversal pattern.
If no meaningful decline exists before the candle forms, the pattern loses much of its significance.
Without a downtrend, there is nothing for the hammer to reverse.
Entering Without Confirmation
Many beginners enter trades immediately after spotting a hammer.
While this can occasionally produce excellent entries, it also increases the risk of acting on false signals.
Waiting for confirmation often improves trade quality.
Ignoring Support and Resistance
A hammer forming at a major support level is typically more meaningful than one forming in the middle of a trading range.
Location is often just as important as the candle itself.
Placing Stop Losses Too Tight
The market frequently retests important price levels before moving higher.
Stops placed too close to the hammer’s body may be triggered by normal market volatility.
Many traders use the hammer’s low as a logical stop-loss reference point.
Risking Too Much on a Single Trade
Even perfect-looking hammer setups can fail.
No candlestick pattern guarantees success.
Professional traders focus on controlling risk, preserving capital, and maintaining consistency over a large sample of trades rather than relying on any single setup.
Forgetting That the Hammer Is Only One Piece of Evidence
The hammer should be viewed as one component of a broader trading strategy.
The strongest setups typically combine:
- A hammer candlestick
- Strong support
- Favorable market structure
- Confirmation signals
- Sound risk management
When these elements work together, the hammer can become a powerful tool for identifying potential bullish reversals.
Did You Know?
The hammer candlestick has a long history in technical analysis and remains one of the most studied reversal patterns among traders worldwide. Here are some interesting facts about this popular candlestick formation.
The Hammer Candlestick Originated From Japanese Candlestick Analysis
The hammer pattern is part of the Japanese candlestick charting system, which was developed centuries ago by Japanese rice traders. These traders used candlestick techniques to analyze market sentiment and identify potential turning points in price.
Today, candlestick analysis is widely used across global financial markets, including stocks, Forex, futures, commodities, and cryptocurrencies.
The Pattern Became Popular Worldwide Through Modern Technical Analysis
Japanese candlestick techniques gained widespread recognition among Western traders through educational works such as Japanese Candlestick Charting Techniques. These publications helped introduce traders to patterns like the hammer, shooting star, engulfing pattern, and doji.
As a result, the hammer became one of the most recognized bullish reversal signals in technical analysis.
Not Every Long-Legged Candle Is a Hammer Candlestick
One of the most common misconceptions is that every candle with a long lower wick qualifies as a hammer.
For a candle to be considered a valid hammer, it should generally:
- Form after a downtrend
- Have a small body near the top of its range
- Possess a lower shadow at least twice the size of the body
- Show meaningful rejection of lower prices
Without the proper structure and market context, a long-wicked candle may simply be ordinary price volatility rather than a true hammer pattern.
The Hammer Candlestick Reflects a Shift in Market Psychology
The hammer’s importance comes from the battle between buyers and sellers that occurs during its formation.
Sellers initially drive prices lower, but buyers eventually regain control and push the market back toward the session high. This shift in sentiment is what makes the pattern a potential reversal signal.
Confirmation Is Often More Important Than the Hammer Candlestick Itself
Many professional traders do not enter a trade solely because a hammer appears on a chart. Instead, they wait for additional evidence that buyers are actually taking control.
A bullish confirmation candle, increased volume, or supporting technical signals can significantly improve the quality of a hammer-based trading setup.
Hammers Can Appear in Every Financial Market
The hammer pattern is not limited to stocks. Because it reflects basic market psychology and price action, it can be found in:
- Forex markets
- Cryptocurrency markets
- Stock markets
- Commodity markets
- Futures markets
- Exchange-traded funds (ETFs)
This versatility is one reason the hammer remains a favorite pattern among traders around the world.
Frequently Asked Questions (FAQ)
What is the hammer candlestick pattern meaning?
The hammer candlestick pattern signals a possible bullish reversal after a downtrend. It reflects a market that rejected lower prices and may be preparing to rise.
How reliable is the hammer candle?
The hammer candle is fairly reliable when it occurs after a clear downtrend and is confirmed by a strong bullish candle. It is more accurate on higher timeframes.
Can I trade based only on a hammer?
While the hammer is powerful, it’s best used with confirmation and in conjunction with support levels or other indicators.
What is the double hammer candlestick pattern?
A double hammer candlestick pattern consists of two consecutive hammers. This strengthens the reversal signal, showing that buyers are defending the price level more than once.
What if I see 2 hammer candlesticks in a row?
Two hammers in a row indicate potential strength, especially if the second has a higher close. This suggests continued buying pressure.
What does 3 hammer candlesticks in a row indicate?
Seeing 3 hammer candlesticks in a row may indicate strong accumulation and an increased chance of a reversal. It can also signal that a bottom is forming.
What is the difference between a hammer and a bearish hammer?
The term bearish hammer is often used incorrectly. True hammers are bullish. If the candle appears in an uptrend with a long upper wick, it is likely an inverted hammer or shooting star, not a hammer.
Is the hammer candlestick used in Forex and crypto trading?
Yes, the hammer candlestick works across markets including Forex, crypto, stocks, and futures. It reflects universal price psychology.
Conclusion
The hammer candlestick is a key reversal signal that traders can use across multiple markets. Understanding its structure, context, and variations, like the double hammer pattern or 3 hammer setup, can help you make smarter trade decisions.
Whether you’re analyzing a bullish hammer or avoiding a bearish hammer, remember that confirmation and market context are crucial. By mastering the hammer candlestick pattern, you gain a powerful tool in your technical analysis toolbox.
To explore more chart patterns and price action strategies, visit our Technical Analysis section for in-depth guides and insights.