
The hanging man candlestick is a classic bearish reversal pattern in technical analysis. Often found at the top of an uptrend, it signals that buying momentum is weakening and that a potential trend reversal may be near. Understanding how to recognize and confirm the hanging man pattern can help traders lock in profits and avoid late entries.
What Is the Hanging Man Candlestick?
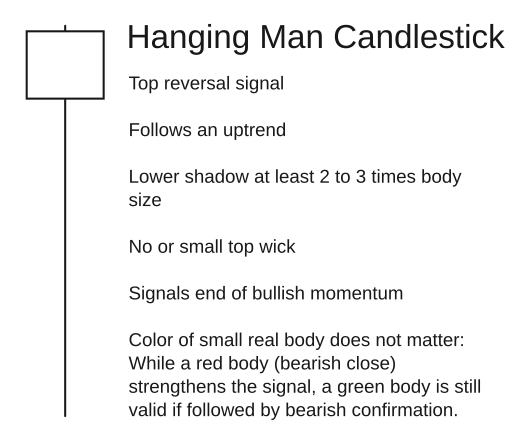
The hanging man candlestick is a single-candle pattern that appears after an uptrend and hints at a possible market top. It features a small real body near the top of the price range and a long lower shadow, resembling a person hanging by their feet, hence the name.
Key Characteristics of a Candle Hanging Man Pattern
- Small real body (red or green) near the candle’s high
- Long lower shadow (at least twice the length of the body)
- Little to no upper shadow
- Appears after an uptrend
- Signals potential bearish reversal, especially when confirmed by the next candle
This pattern reflects a session where sellers briefly gained control, pushing the price lower, before buyers pulled it back up, but not strongly enough to signal continued strength.
How to Identify a Hanging Man Pattern Candlestick
To spot a valid hanging man pattern candlestick, look for the following:
- Location matters most: It must appear after a bullish trend.
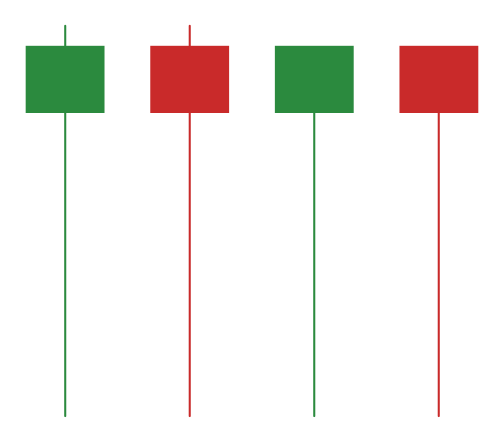
- Long lower wick: Should be at least 2–3 times the size of the real body.
- Small body: The smaller the real body, the more significant the reversal signal.
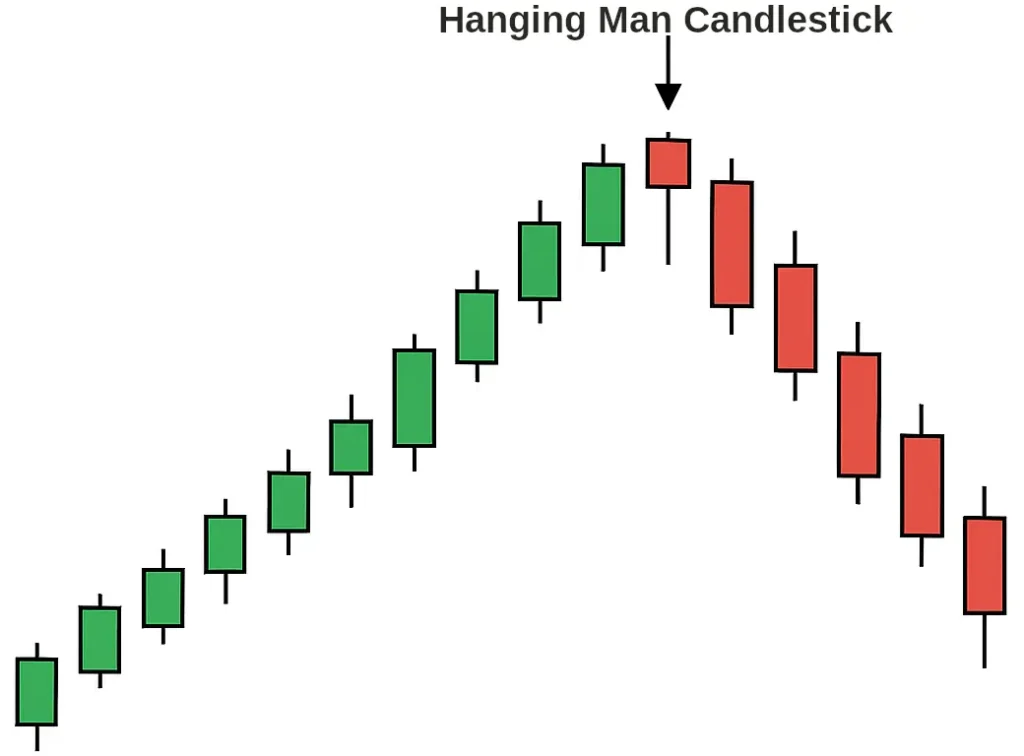
- Confirmation needed: A bearish candle following the hanging man strengthens the signal.
This pattern is most effective when accompanied by other indicators such as volume spikes, resistance zones, or RSI divergence.
Bearish vs. Bullish Hanging Man
While the bearish hanging man is more common and relevant, the color of the candle can still influence how it’s interpreted:
- Bearish Hanging Man (red candle): Stronger reversal signal, especially with high volume and bearish follow-through.
- Bullish Hanging Man (green candle): Still valid, but slightly weaker unless confirmed by subsequent price action.
In both cases, context and confirmation are essential for effective use.
Trading the Hanging Man Candlestick
Here’s a simple approach to trading the hanging man candlestick:
Step-by-Step Setup
- Identify a strong uptrend leading into the hanging man.
- Wait for a valid hanging man candle to form.
- Confirm with a bearish candle closing below the hanging man’s real body.
- Enter a short position after confirmation.
- Place a stop loss above the high of the hanging man.
- Set a take profit at the nearest support zone or a 2:1 risk-reward ratio.
Table: Hanging Man Trade Setup
| Element | Description |
|---|---|
| Trend | Prior uptrend |
| Pattern Signal | Hanging man candlestick with long lower wick |
| Confirmation | Bearish candle after the pattern |
| Entry | Close of confirmation candle |
| Stop Loss | Above hanging man high |
| Take Profit | Support level or risk-reward target |
Tips for Hanging Man Candlestick
- Always wait for confirmation before entering trades.
- Use the pattern in combination with trendlines, resistance levels, or oscillators like RSI or MACD.
- Avoid acting on a hanging man in sideways or choppy markets.
- On higher timeframes, the signal is more reliable.
- Watch for volume increase on the hanging man candle for added weight.
Did You Know About Hanging Man Candlestick?
- The hanging man was originally described in Japanese candlestick theory, dating back centuries to rice trading.
- It is the bearish counterpart to the hammer candlestick, which appears at the bottom of a downtrend.
- In some cases, a bullish hanging man (green candle) can trap traders into thinking the trend will continue, only to reverse sharply after.
- When the lower wick is extremely long, it suggests strong intraday selling pressure that failed to maintain upward momentum.
Frequently Asked Questions About the Hanging Man Candlestick
What does the hanging man candlestick indicate?
The hanging man candlestick signals that a bullish trend may be nearing its end. It reflects weakening buying pressure and potential reversal if confirmed by a bearish candle.
How can I confirm a hanging man pattern?
Confirmation typically comes from a bearish candle that closes below the hanging man’s body, ideally on increased volume or near a resistance level.
Is a bullish hanging man still valid?
Yes, but a green-bodied hanging man is considered weaker than a red one. It still suggests exhaustion but requires stronger confirmation.
Is the hanging man pattern effective on all timeframes?
It can appear on any timeframe, but it’s more reliable on higher timeframes like 1-hour, 4-hour, or daily charts.
What’s the difference between a hammer and a hanging man?
Both have long lower shadows and small bodies, but:
- A hammer appears at the bottom of a downtrend (bullish reversal).
- A hanging man appears at the top of an uptrend (bearish reversal).
Can I use the hanging man candlestick in Forex and crypto?
Absolutely. The candle hanging man setup works well in Forex, crypto, stocks, and futures, provided market context and confirmation are present.
Conclusion
The hanging man candlestick is a reliable signal that can alert traders to potential reversals at the top of an uptrend. While not a standalone entry trigger, it becomes powerful when combined with other tools and proper risk management.
To learn more about candlestick patterns and trading signals, visit our Technical Analysis section for in-depth insights and strategies.