
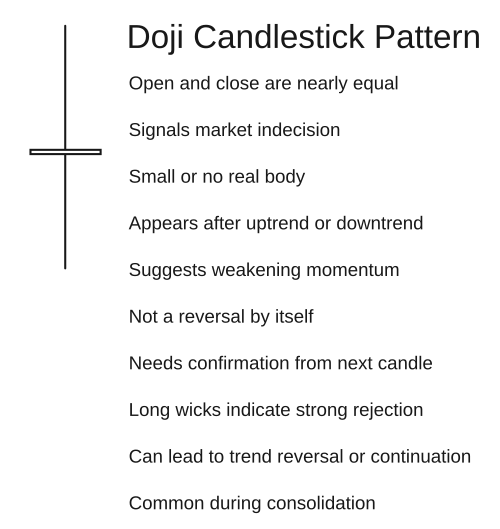
The doji candlestick pattern is one of the most important signals in technical analysis. It forms when a market opens and closes at nearly the same price, creating a candle that looks like a cross or plus sign. This small but powerful formation often signals market indecision, and depending on its context, can warn of a reversal.
Understanding the doji candle, its variations, and what it means in different market trends can help traders make smarter decisions with less risk.
What Is the Doji Candlestick Pattern?
The doji candlestick pattern is a single-candle formation where the opening and closing prices are nearly identical. The result is a candle with little to no real body, but often long upper or lower shadows, depending on market volatility.
This formation reflects a balance between buyers and sellers. Neither side is in control, which makes the doji candle a sign of indecision or pause. However, in some cases, a doji can also indicate exhaustion of a trend and a potential reversal.
Types of Doji Candlesticks
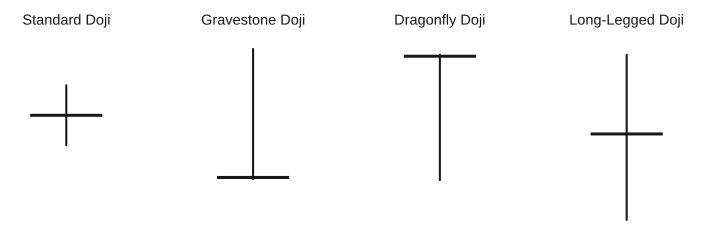
There are several variations of the doji candlestick, each with unique characteristics and implications:
| Doji Type | Description |
|---|---|
| Standard Doji | Neutral candle with no significant upper or lower wick. |
| Gravestone Doji | Long upper shadow, no lower shadow, often a bearish reversal signal. |
| Dragonfly Doji | Long lower shadow, no upper shadow, usually bullish in a downtrend. |
| Long-Legged Doji | Long upper and lower wicks, reflects high indecision and volatility. |
Each variation provides different insights depending on its position in the trend and accompanying candles.
Doji Candle Meaning in Trends
The doji candle meaning varies based on the existing market trend:
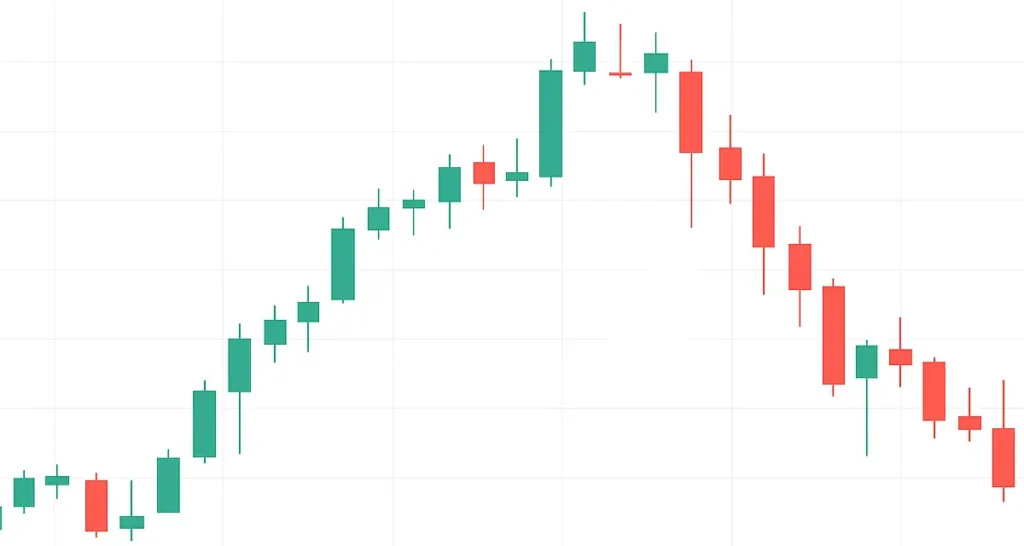
- Uptrend: A doji can signal bullish exhaustion. Traders often interpret it as a warning of a potential reversal.
- Downtrend: It may suggest bearish weakening, creating opportunities for a bullish reversal.
- Sideways trend: The doji confirms indecision and often signals continuation unless followed by a breakout candle.
Context is key, always confirm with the next few candles or supporting indicators before making a decision.
Bearish and Bullish Doji Patterns
Bearish Doji Candlestick Pattern
- Found after an uptrend.
- Often accompanied by a gravestone doji or a doji near resistance.
- Confirmation: A strong red candle following the doji helps validate the bearish reversal.
Bullish Doji Candlestick Pattern
- Found after a downtrend.
- Commonly includes a dragonfly doji or a doji at support.
- Confirmation: A bullish candle that closes above the high of the doji signals a potential uptrend.
How to Trade the Doji Candle Pattern
Here’s a basic step-by-step approach to trading a doji candlestick pattern:
- Identify the trend leading into the doji.
- Look for a doji formation near support, resistance, or a Fibonacci level.
- Wait for confirmation with a strong bullish or bearish candle.
- Enter the trade based on confirmation direction.
- Set a stop-loss beyond the high/low of the doji wick.
- Target profits at key support/resistance zones or using risk-reward ratios.
Tips for the Doji Candlestick Pattern
- Always look for confirmation after a doji before entering a trade.
- Use volume analysis, high volume on a doji may signal a stronger reversal.
- Combine with trendlines, moving averages, or RSI for higher accuracy.
- Avoid trading doji patterns in low-volume or sideways markets.
- The location of the doji in the trend is more important than the pattern itself.
Did You Know About the Doji Candlestick Pattern?
- The word “Doji” comes from Japanese, meaning “blunder” or “mistake,” referring to how rare it is for open and close to match exactly.
- A gravestone doji resembles an inverted “T” and often appears before sharp downward moves.
- Doji patterns are one of the original candlestick signals described in the 18th-century rice markets of Japan.
- In many strategies, the doji is a neutral pattern that becomes powerful only with confirmation.
Frequently Asked Questions About the Doji Candlestick Pattern
What does a doji candlestick mean?
A doji candlestick indicates market indecision. The opening and closing prices are nearly the same, showing a balance between buyers and sellers.
Is the doji pattern bullish or bearish?
It can be either, depending on its position in the trend. In an uptrend, it may signal a bearish reversal; in a downtrend, a bullish reversal.
How do I trade a doji candle?
Look for a doji after a clear trend, and wait for a confirmation candle before entering a trade. Use stops and targets based on recent highs/lows.
What is a gravestone doji?
A gravestone doji has a long upper shadow and no lower shadow. It usually forms at market tops and signals a potential bearish reversal.
Can a doji appear in any timeframe?
Yes, doji candlesticks can appear on any chart timeframe, but are more reliable on higher timeframes like 1-hour, 4-hour, or daily charts.
Is a doji the same as a spinning top?
No. A doji has virtually no real body, while a spinning top has a small body. Both indicate indecision, but the doji is considered stronger.
Conclusion on the Doji Candlestick Pattern
The doji candlestick pattern is a vital tool for identifying indecision and potential reversals in price action. Whether you’re trading stocks, Forex, crypto, or futures, recognizing a doji candle can help you avoid risky entries and spot trend exhaustion early.
Be sure to combine it with context, confirmation, and proper risk management. For more technical analysis tools, visit our Technical Analysis section.