The Heikin Ashi candle is a modified candlestick used in technical analysis to help traders identify trends with greater clarity. Unlike traditional candlesticks, Heikin Ashi candles smooth out price data to filter out market noise. This makes it easier to spot trends, reversals, and momentum shifts—especially for swing traders and trend followers.
In this article, we provide a complete Heikin Ashi candlesticks tutorial, cover how they are calculated, how to read them, common Heikin Ashi candle patterns, and how to build an effective Heikin Ashi candle strategy.
Table of Contents
- Heikin Ashi Candles Explained
- How to Read Heikin Ashi Candle Patterns
- Heikin Ashi Candle Strategy for Traders
- Tips for the Heikin Ashi Candle
- Did You Know About Heikin Ashi?
- Frequently Asked Questions (FAQ)
- What is a Heikin Ashi candle?
- How do Heikin Ashi candles differ from traditional candlesticks?
- What are Heikin Ashi reversal candles?
- Can I use Heikin Ashi for day trading?
- What indicators work well with Heikin Ashi?
- How reliable are Heikin Ashi candle patterns?
- Is there a Heikin Ashi candlesticks tutorial for beginners?
- Can I automate a Heikin Ashi candle strategy?
- Conclusion
Heikin Ashi Candles Explained
The term Heikin Ashi means “average bar” in Japanese. Heikin Ashi candles differ from traditional candlesticks in how the open, close, high, and low values are calculated. Here’s how:
Heikin Ashi Calculation:
| Component | Formula |
|---|---|
| Close | (Open + High + Low + Close) ÷ 4 |
| Open | (Previous Open + Previous Close) ÷ 2 |
| High | Max of (High, Open, Close) |
| Low | Min of (Low, Open, Close) |
These calculations result in smoother candles that eliminate many of the minor fluctuations seen in standard candlestick charts.
The Heikin Ashi candlestick is a specific type of candlestick chart that is automatically generated by trading platforms when you choose the Heikin Ashi setting—it’s not drawn manually or created from regular candlesticks.
Here’s what that means in practice
- Heikin Ashi (“average bar” in Japanese) is a calculated form of candlestick, not a raw price representation like standard candlesticks.
- Instead of using just the open, high, low, and close of each time period, Heikin Ashi candles are calculated using averages from the current and previous candles, which smooths out noise.
- Most trading platforms like TradingView, MetaTrader, ThinkorSwim, and NinjaTrader allow you to switch between Standard Candlestick and Heikin Ashi chart types.
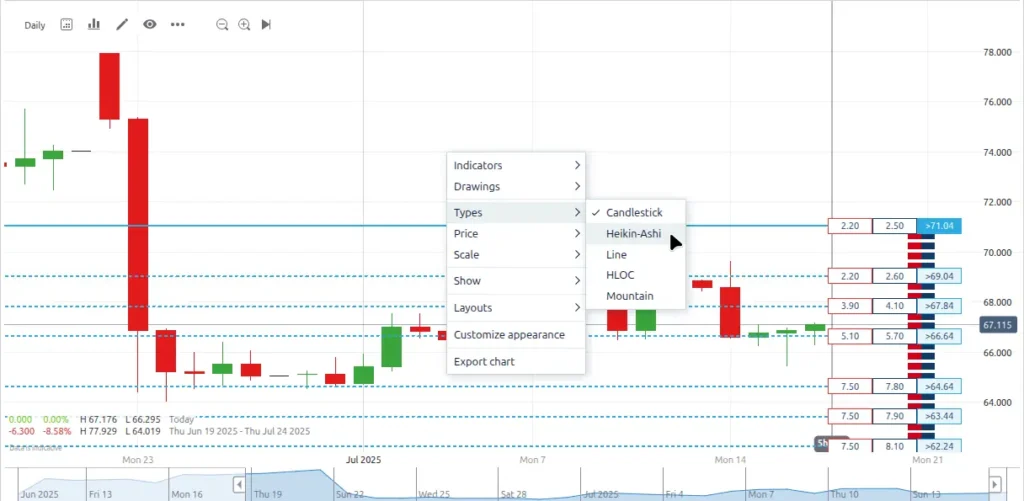
The following image shows an example of the Heikin Ashi setting on a menu in the chart software. Right-clicking on the chart brings up the menu.
The Heikin Ashi formula
- Close = (Open + High + Low + Close) / 4
- Open = (Previous Heikin Ashi Open + Previous Heikin Ashi Close) / 2
- High = Max(High, Heikin Ashi Open, Heikin Ashi Close)
- Low = Min(Low, Heikin Ashi Open, Heikin Ashi Close)
When you select the Heikin Ashi setting in your charting software, it automatically calculates and displays these custom candles using its own logic, offering a smoothed-out view of market trends.
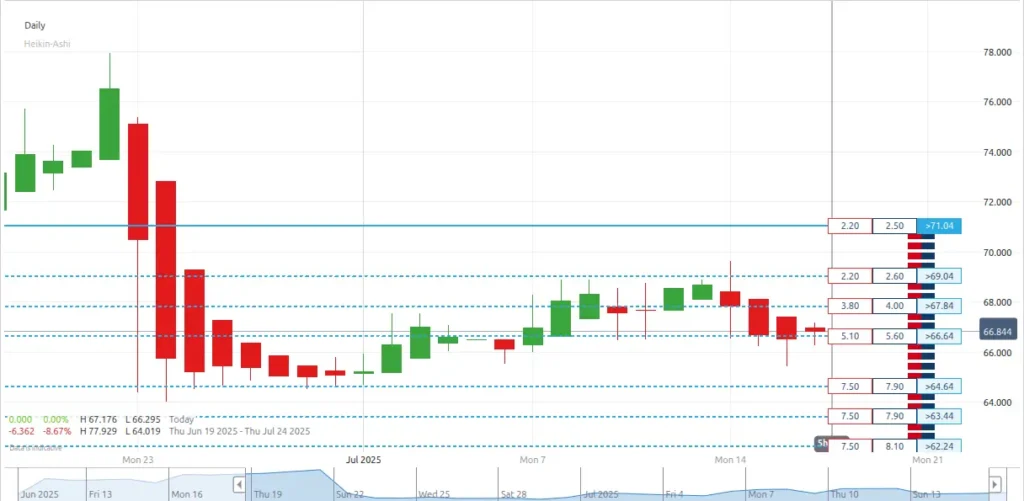
After selecting the Heikin-Ashi setting from the menu shown in the previous image, the same trading data looks as follows.
How to Read Heikin Ashi Candle Patterns
Understanding Heikin Ashi candle patterns can give traders early insight into market sentiment and possible trend direction.
Common Patterns to Know
- Long Green (or White) Candles: Indicate a strong uptrend. No lower shadow suggests strong momentum.
- Long Red (or Black) Candles: Signal a strong downtrend, especially if there’s no upper shadow.
- Small Candles with Both Wicks: Often signal a potential reversal or market indecision.
- Heikin Ashi Doji: A small-bodied candle with long upper and lower wicks, suggesting a possible trend change.
These patterns help traders identify Heikin Ashi reversal candles, which are useful signals for entering or exiting positions.
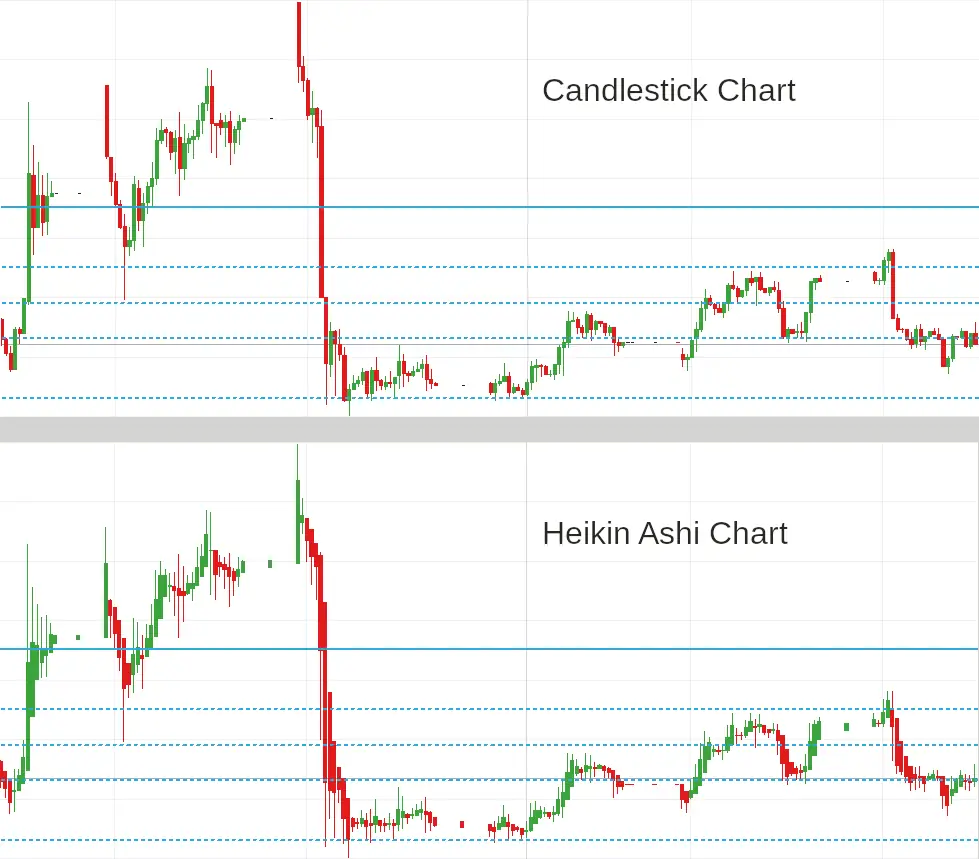
The following image shows a normal candlestick chart at the top compared to a Heikin Ashi chart below. Both charts are based on the same trading data.
Heikin Ashi Candle Strategy for Traders
A Heikin Ashi candle strategy typically focuses on riding trends until a reversal candle forms.
Basic Strategy Steps
- Identify the trend using multiple consecutive same-color candles.
- Enter the trade after a few confirming candles in the trend direction.
- Use reversal candles as exit signals or to consider switching direction.
- Combine with indicators like the Heiken Ashi indicator, RSI, or moving averages for confirmation.
This strategy is effective in trending markets but may lag in choppy or sideways markets due to the smoothing nature of Heikin Ashi.
Tips for the Heikin Ashi Candle
- Use Heikin Ashi on longer timeframes for more reliable trend signals.
- Combine with volume indicators to validate breakout moves.
- Avoid using Heikin Ashi alone for entry/exit—confirmation tools increase accuracy.
- Pay attention to shadowless candles as signs of trend strength.
- Use Heikin Ashi for trend following, not for pinpoint entries.
Did You Know About Heikin Ashi?
- Heikin Ashi candles were popularized in Japan and have been used for centuries.
- They are especially useful for traders who prefer visual clarity over precision price points.
- Some professional trading platforms offer the Heiken Ashi indicator as an overlay on standard candles.
- Algorithmic and quant traders may apply Heikin Ashi smoothing to remove short-term volatility from signals.
Frequently Asked Questions (FAQ)
What is a Heikin Ashi candle?
A Heikin Ashi candle is a type of candlestick that uses averaged price data to create smoother chart patterns, helping traders better identify trends and reversals.
How do Heikin Ashi candles differ from traditional candlesticks?
Traditional candlesticks show exact price action per time frame, while Heikin Ashi candles average price data to reduce market noise.
What are Heikin Ashi reversal candles?
Reversal candles are Heikin Ashi candlesticks that indicate a possible change in trend, such as doji-like formations with wicks on both sides after a long trend.
Can I use Heikin Ashi for day trading?
Yes, but Heikin Ashi is better suited for swing trading or trend-following strategies. Intraday traders may find the lag less suitable for scalping.
What indicators work well with Heikin Ashi?
Popular combinations include the Heiken Ashi indicator, RSI, MACD, and exponential moving averages (EMAs).
How reliable are Heikin Ashi candle patterns?
They’re reliable for identifying broad trends but should be confirmed with additional indicators for accurate trading decisions.
Is there a Heikin Ashi candlesticks tutorial for beginners?
Yes, many platforms and charting software offer built-in tutorials. This article itself serves as a Heikin Ashi candlesticks tutorial for newcomers.
Can I automate a Heikin Ashi candle strategy?
Yes, many algorithmic platforms support automation using Heikin Ashi logic for trend filtering and signal generation.
Conclusion
The Heikin Ashi candle is a powerful tool for traders seeking to identify and follow clear trends without being distracted by short-term fluctuations. By understanding Heikin Ashi patterns and using a well-thought-out Heikin Ashi strategy, traders can make more informed decisions with greater confidence.
Whether you’re a beginner learning from a Heikin Ashi candlesticks tutorial or an experienced trader refining your edge, incorporating these smoothed candles into your trading toolkit can enhance clarity and improve results.
To learn more about candlestick patterns and trading signals, visit our Technical Analysis section for in-depth insights and strategies.