The shooting star candlestick pattern is a widely recognized bearish reversal signal used in technical analysis. It helps traders identify potential trend tops and make more informed decisions when markets are overextended. In this article, we break down what the shooting star candlestick means, how to spot it, and how to use it effectively in your trading strategy.
Table of Contents
- What Is the Shooting Star Candlestick Pattern?
- Shooting Star Candlestick Meaning in Technical Analysis
- How to Use the Shooting Star in Trading
- Bearish Shooting Star vs. Other Candles
- Tips for the Shooting Star Candlestick Pattern
- Did You Know About the Shooting Star Candlestick Pattern?
- Frequently Asked Questions About the Shooting Star Candlestick Pattern
- What does the shooting star candlestick pattern indicate?
- How can I identify a shooting star in technical analysis?
- Is the shooting star candle pattern always bearish?
- Can the shooting star be used in Forex or crypto trading?
- How is a shooting star different from an inverted hammer?
- What is the best time frame for shooting star trading?
- Can I rely on a shooting star without confirmation?
- Conclusion
What Is the Shooting Star Candlestick Pattern?
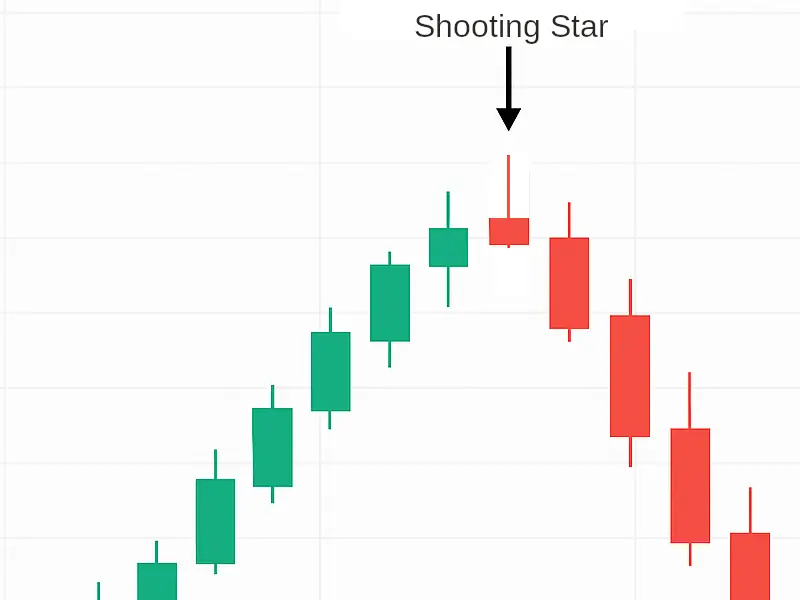
The shooting star candlestick pattern is a bearish formation that occurs after an uptrend. It signals that buyers tried to push the price higher, but sellers regained control and forced the price back down before the close.
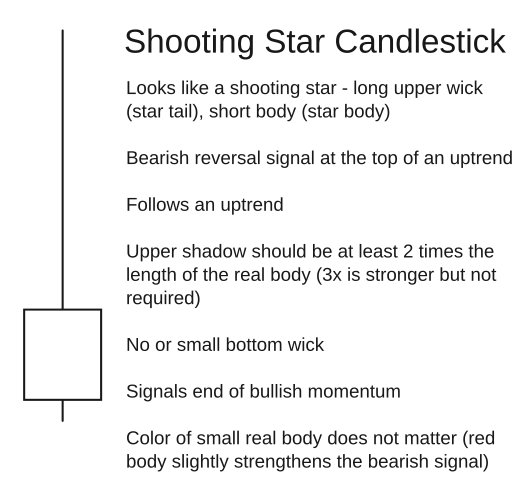
Key Characteristics of the Shooting Star Candlestick Pattern
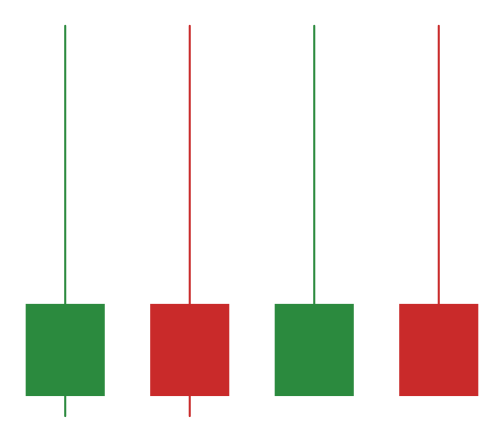
- Small real body near the candle’s low
- Long upper shadow, at least twice the size of the body
- Little or no lower shadow
- Occurs after a price rally or in an uptrend
This structure forms a shape similar to an upside-down hammer, visually resembling a shooting star, which gives the pattern its name.
Shooting Star Candlestick Meaning in Technical Analysis
In technical analysis, a shooting star candlestick represents a failed attempt by bulls to continue pushing the price upward. When this candle appears after a strong uptrend, it often suggests a potential reversal or loss of momentum.
- The upper wick indicates the high of buyer enthusiasm.
- The close near the low shows sellers were strong by the end of the session.
- The small body highlights market indecision leaning toward bearish pressure.
This makes the shooting star one of the most reliable bearish candlestick patterns when confirmed by additional indicators or price action.
How to Use the Shooting Star in Trading
Steps for Shooting Star Trading
- Identify an uptrend or recent price rally.
- Look for a shooting star candle pattern near resistance or after a large bullish candle.
- Wait for confirmation from the next candle, ideally a bearish candle closing below the shooting star’s body.
- Enter a short trade after confirmation.
- Place a stop loss above the high of the shooting star.
- Use support levels, Fibonacci retracement zones, or risk-reward targets to plan your take profit.
Shooting Star Trading Example Table
| Component | Description |
|---|---|
| Trend | Prior uptrend |
| Pattern | Shooting star candle pattern |
| Confirmation | Bearish close on the next candle |
| Entry Point | Break below the shooting star’s low |
| Stop Loss | Above the shooting star’s high |
| Target | Previous support or set risk-reward ratio |
Bearish Shooting Star vs. Other Candles
- A bearish shooting star must appear after an upward move to be valid.
- Do not confuse it with an inverted hammer, which may appear at the bottom of a downtrend and has different implications.
- Always combine the shooting star with volume analysis, trend context, or technical indicators for better results.
Tips for the Shooting Star Candlestick Pattern
- Confirm with RSI or stochastic, overbought levels strengthen the pattern.
- Look for shooting stars near resistance zones or trend lines.
- Use longer timeframes (e.g., daily) for stronger signals.
- Avoid trading shooting stars in sideways or consolidating markets.
- Pair the pattern with trend reversal indicators like MACD crossovers.
Did You Know About the Shooting Star Candlestick Pattern?
- The shooting star was one of the original Japanese candlestick patterns documented in early rice trading records centuries ago.
- It’s often referred to as a “graveyard star” in some older literature due to its ominous appearance.
- When found on high volume near all-time highs, it can signal significant institutional selling.
- The pattern is more reliable on longer timeframes and in markets with high liquidity.
Frequently Asked Questions About the Shooting Star Candlestick Pattern
What does the shooting star candlestick pattern indicate?
The shooting star candlestick pattern indicates a potential bearish reversal after an uptrend. It shows that buyers lost control and sellers gained momentum by the close.
How can I identify a shooting star in technical analysis?
Look for a candle with a small body near the low, a long upper wick, and little or no lower wick. It must appear after an uptrend to be considered valid in technical analysis.
Is the shooting star candle pattern always bearish?
Yes, the shooting star candle pattern is inherently bearish. However, it should always be used with confirmation to avoid false signals.
Can the shooting star be used in Forex or crypto trading?
Absolutely. The shooting star in technical analysis works across all markets, including Forex, crypto, stocks, and commodities, due to its reflection of market psychology.
How is a shooting star different from an inverted hammer?
While they look similar, a shooting star appears after an uptrend and is bearish. An inverted hammer appears after a downtrend and may signal a bullish reversal.
What is the best time frame for shooting star trading?
The daily timeframe provides the most reliable signals for shooting star trading. However, 4-hour and weekly charts can also be effective depending on the asset and volatility.
Can I rely on a shooting star without confirmation?
It’s not recommended. Always wait for a confirmation candle, a bearish close after the shooting star, before entering a trade.
Conclusion
The shooting star candlestick pattern is a powerful bearish signal that can help traders spot potential market tops and reversals. By learning how to identify and confirm the pattern, and combining it with solid risk management and supporting indicators, traders can use this pattern as a reliable tool in their strategy.
For deeper insights into price patterns and market behavior, explore our full Technical Analysis section.